
Introduction
Token listings are some of the most volatile and strategic moments in a cryptocurrency’s lifecycle. They influence price, liquidity, and trader behavior in profound ways—yet most data-driven studies only scratch the surface. That's why we have built a new agent-based simulation (ABS) framework specifically designed to model and analyze what happens during and after a crypto token listing. This simulator creates an artificial crypto market populated by different types of traders reacting to various factors like liquidity injections, return on investment (ROI), market conditions or asymmetric information. Unlike traditional models that rely only on historical data, our ABS approach allows us to explore what-if scenarios, isolate key market mechanics, and better understand the dynamics of listings in realistic yet controlled environments.
For funds trading in primary markets or projects with upcoming token launches, our ABS framework can become a powerful tool: it can stress test market designs, evaluate short-term risks, and optimize entry or exit strategies. In upcoming posts, we’ll walk through how the simulator works, what we’ve learned from key experiments, and how these insights can shape better decisions in early-stage crypto markets.
Overview of Cryptocurrency listings
A token listing marks its transition from private issuance to public trading, whether on centralized venues like Binance or decentralized platforms such as Uniswap. This event unlocks liquidity and enables real-time price discovery, but the choice of venue drives fundamentally different market dynamics: centralized exchanges enforce strict, often opaque listing criteria and maintain deep order books, whereas decentralized exchanges permit immediate, permissionless trading that can be less liquid and more volatile.
After listing, a token’s trajectory depends on the depth of its initial liquidity—deep pools cushion against large swings, while thin liquidity amplifies slippage—alongside the initial circulating supply unlocked by vesting schedules, which modulate early selling pressure. The mix of participants also matters: institutional buyers and early backers typically execute measured exits, while retail traders may chase momentum or react emotionally, triggering sharp price moves. How tokens were distributed pre-listing (private sale, public sale, airdrops, farming) shapes holders’ incentives to lock up or dump positions, and prevailing market sentiment—bullish or bearish—can amplify or mute these flows. Finally, exchange-specific features such as order-book depth, latency, fee structures, and user demographics further influence execution quality and trader behavior at launch.
Our agent-based simulator weaves together these factors—liquidity provisioning, vesting mechanics, investor risk profiles, and exchange microstructure—to let us experiment with alternative allocation strategies, liquidity sizes, and launch timings, quantifying their impact on volatility, price evolution, and overall market dynamics in the critical early phases of a crypto listing.
Simulation Framework
At the core of our work is a custom agent-based simulation (ABS) model that recreates the dynamics of a token listing within a synthetic crypto market, populated by heterogeneous traders and driven by real-world–inspired market mechanics. The framework is organized into four principal components: the agents (each with distinct decision rules and risk profiles), the market engine (either a limit order book or an automated market maker), the main simulator (which iteratively processes orders, updates agents’ states, and records metrics), and the experimental tools (a suite for defining, running, and analyzing both single runs and extensive Monte Carlo or sensitivity-analysis campaigns).
Rather than overfitting to past listings, we calibrate only key parameters—such as initial token and cash distributions—using proprietary tokenomics data, while keeping all other elements flexible for broad experimentation. In each simulation, the user first specifies listing conditions (e.g., token float, agent cohorts, initial liquidity). Next, agents act in parallel, placing or withholding buy/sell orders based on their portfolio targets, return vs. risk calculations, and stochastic noise. The matching engine then executes compatible orders or queues them, determining trade prices and fills. After each tick, the simulator updates the market state—including mid-price, spread, and depth—and relays the outcomes back to agents, ensuring realistic feedback loops such as price impact and liquidity shifts.
Finally, once a run completes, the experimental tools aggregate results at both the market and grouped-agent levels—producing metrics like price trajectories, volatility, average PnL, and trade counts—enabling rigorous comparison of tokenomics strategies, exchange type, and agent behaviors under uncertainty. This modular, transparent design empowers practitioners to stress-test listing scenarios, perform counterfactual analyses, and derive actionable insights for token issuance and launch strategy.

Figure 1. High-level organization and functioning of the ABS modelling framework for cryptocurrency listings.
We now dive briefly into how these agents behave, how different market types affect price discovery, and what kinds of questions the simulation can help answer for crypto investors, fund managers, and token design teams.
Market type
The simulator implements two core trading mechanisms—a Limit Order Book (LOB) and an Automated Market Maker (AMM)—to mirror the execution engines found in real crypto markets. In LOB mode, agents submit market or limit orders into a central order book that enforces price–time priority (best prices first, then earliest orders), dynamically updating depth as trades occur. Market orders consume all available liquidity on the opposite side, while limit orders execute immediately if they cross the spread or else rest in the book until matched. In AMM mode, there is no order queue—trades interact directly with a liquidity pool governed by a constant-product invariant (as in Uniswap v2). Each buy or sell computes the required token amount against reserves (including fees), checks against the agent’s slippage bounds, and immediately updates pool reserves and prices if liquidity suffices; otherwise, the trade is rejected.
Agents
Our simulator features a diverse population of trading agents engineered to mirror real‐world investor behavior through bounded rationality, inventory management, and stochastic decision-making. Each agent maintains separate balances of cash and tokens, evaluates a cash-to-token (CT) ratio, expected return on investment (ROI), and an individual risk aversion level, and adds a calibrated noise term to avoid overly deterministic actions . Agents use these inputs to decide whether to enter the market, and if so, whether to buy or sell, sizing orders to restore their target CT ratio without ever allowing negative holdings . Beyond this base market agent, an agent factory efficiently instantiates large cohorts with varied holdings, risk profiles, and activation times—enabling scalable experimentation across heterogeneous trader mixes.

Figure 2. Simplified decision logic of a trading agent based on ROI, risk level, noise, and portfolio ratios.
In a typical token listing simulation, we focus on two principal investor groups:
Early Investors: Hold sizeable token allocations from private or strategic rounds, often seeking to realize gains quickly. They are modeled with high initial token balances and an aggressive sell bias, reflecting profit-taking behavior when market prices exceed their cost basis.
Public Traders: Enter at the moment of listing with fresh capital in quoted assets. They exhibit heightened price sensitivity and momentum-driven trading, serving as the primary demand source that absorbs sell-side pressure and drives the initial price spike.
The dynamic tension between these groups—early investors offloading tokens versus new buyers chasing momentum—generates the initial volatility, price spikes, and subsequent corrections that our ABS framework captures and analyzes.
Market simulator
At the core of our agent-based framework lies a modular and extensible market simulator that animates a synthetic crypto ecosystem by iteratively processing agent orders and updating market state in discrete time steps. Each simulation cycle begins with parallel decision-making: agents evaluate their strategies against the current price, spread, and liquidity before submitting buy or sell orders. These orders are then handed off to the chosen matching engine—either a centralized limit order book or a decentralized AMM—which executes or queues trades and immediately records market-level metrics such as mid-price, depth, and spread.
Once trades settle, the simulator updates each agent’s portfolio (balances, PnL, and ROI) and captures feedback loops—for example, how aggressive early selling widens spreads and discourages further buys—thereby generating realistic phenomena like price impact and liquidity crises. At the end of a run, results are aggregated by cohort (e.g., early investors vs. public traders) to yield group-level insights—average PnL, trade counts, and portfolio values—providing a clean interface for downstream visualization, statistical analysis, and policy benchmarking.
Experimental tools
To ensure that our simulation results are robust and meaningful, we’ve integrated a Monte Carlo experimentation module and a flexible sensitivity analysis framework into our simulator. These tools allow us to account for randomness in trader behavior and to evaluate how different parameters—like investor allocations, trading noise, or slippage levels—affect market outcomes during token listings.
Monte Carlo simulations help us understand the range of possible outcomes by running the same experiment many times, each with a different random seed. In every run, the simulator initializes a fresh market environment and a new set of agents with randomized parameters. This allows us to observe not just one outcome, but a full distribution of price paths, trading volumes, and performance metrics. After many runs, we can compute meaningful statistics like average final prices, volatility, and group-level results such as average PnL across early investors or public traders.
Complementing this, the sensitivity analysis module systematically varies key parameters to see how small changes influence larger outcomes. This is especially useful when tuning tokenomics or testing listing strategies. For example, we can study how reducing early investor allocations might impact price stability, or how increasing risk aversion shifts trading behavior. The tool can run either manual experiments with specific settings or automated grid searches that scan a wide range of possibilities, making it ideal for identifying nonlinear effects or critical thresholds.
Together, these tools make our simulation framework not only realistic but also diagnostic. They provide a structured way to explore how agent behavior and market structure interact, giving crypto projects and investors the ability to test hypotheses, benchmark strategies, and build more resilient launch plans for new token listings.
Empirical results
In this section, we present the empirical validation of our ABS framework through a structured series of simulation experiments that systematically vary key tokenomics and market parameters to observe their impact on post-listing price dynamics, volatility, and agent performance. Each experiment isolates a single factor—such as initial liquidity, public traders’ cash reserves, number of public traders, or risk preferences of early investors—and evaluates outcomes using both Monte Carlo experiments (to capture full distributions of price paths and trade metrics) and averaged sensitivity analyses (to identify mean‐behavior trends across parameter grids). To isolate effects and avoid confusion between market mechanics, in this article, we first use a DEX as a market environment. Posterior studies can contrast these findings with limit order book scenarios to evaluate structural differences.
By focusing on a single AMM, we ensure consistent market mechanics while examining how variation in these four parameters shapes the initial price surge, sell-off corrections, and stabilization phase that characterize real token listings. The resulting insights quantify how token float, capital allocation, agent granularity, and behavioral risk profiles interact to drive order-flow imbalances, price impact, and liquidity resilience, offering actionable guidance for designing robust listing strategies.
Initial liquidity
The initial liquidity supplied to the AMM is a fundamental determinant of price stability and volatility during a token listing. We examine five scenarios where pool reserves span from $100 000 to $500 000, observing that low liquidity produces sharp price spikes and erratic corrections — small trades trigger large price swings under the constant-product invariant, resulting in widely dispersed mid-price paths across Monte Carlo experiments. As liquidity increases to moderate levels, these extremes are partially dampened, yielding more tempered surges and smoother declines. When liquidity is high, new orders cause smaller price moves (lower impact), which reduces the incentive for certain agents to trade frequently, thereby slowing the price discovery signal.

Figure 3. Monte Carlo Experiment Average Results for changing DEX initial liquidity value
Public Traders' Cash
The initial cash allocation to public traders is a critical lever in shaping price discovery during a token listing. In our experiments, we vary this from $200 000 to $1 600 000, observing that low funding levels (around $200 000–$400 000) leave public traders unable to absorb early sell pressure, resulting in price collapses and muted recoveries as trajectories often dip below the launch price. As the capital rises to intermediate levels (around $800 000), buy-side pressure intensifies, driving pronounced price surges followed by healthier corrections, though with wider dispersion across simulation paths. At excessively high allocations ($1.2 M–$1.6 M), the market enters a highly reactive state, where early demand can push prices to inflated peaks and elevated volatility, causing many runs to stabilize well above the initial price level, while others endure prolonged, sluggish corrections. These findings demonstrate that public trader capital is the main driver of demand during token listings. With the lowest amount of capital, there is not enough demand to overcome the supply driven by the early investors. With every increase in capital the resulting increase in demand causes larger initial price surges while also stabilizing at a higher level.

Figure 4. Monte Carlo Experiment Average Results for changing Public Traders' Total Cash
Number of Public Traders
We analyze how the size of the public trader cohort—ranging from 300 to 1 500 agents while holding total capital constant—shapes market smoothness and volatility during the listing. With only 300 traders, individual orders wield disproportionate influence, producing highly jagged price trajectories and significant path dependence. As the population grows to 500 and 700, these idiosyncratic shocks are progressively averaged out, yielding smoother mid-price curves and reduced dispersion. At 1 000 and 1 500 agents, simulations reveal tight clustering of price paths around the central trend, demonstrating the law of large numbers in action—more traders foster emergent macro-patterns, dampening noise without shifting the underlying mean trajectory. This result underscores the importance of having a large and diverse group of market participants for achieving reliable price discovery while minimizing volatility in both simulated and real markets.
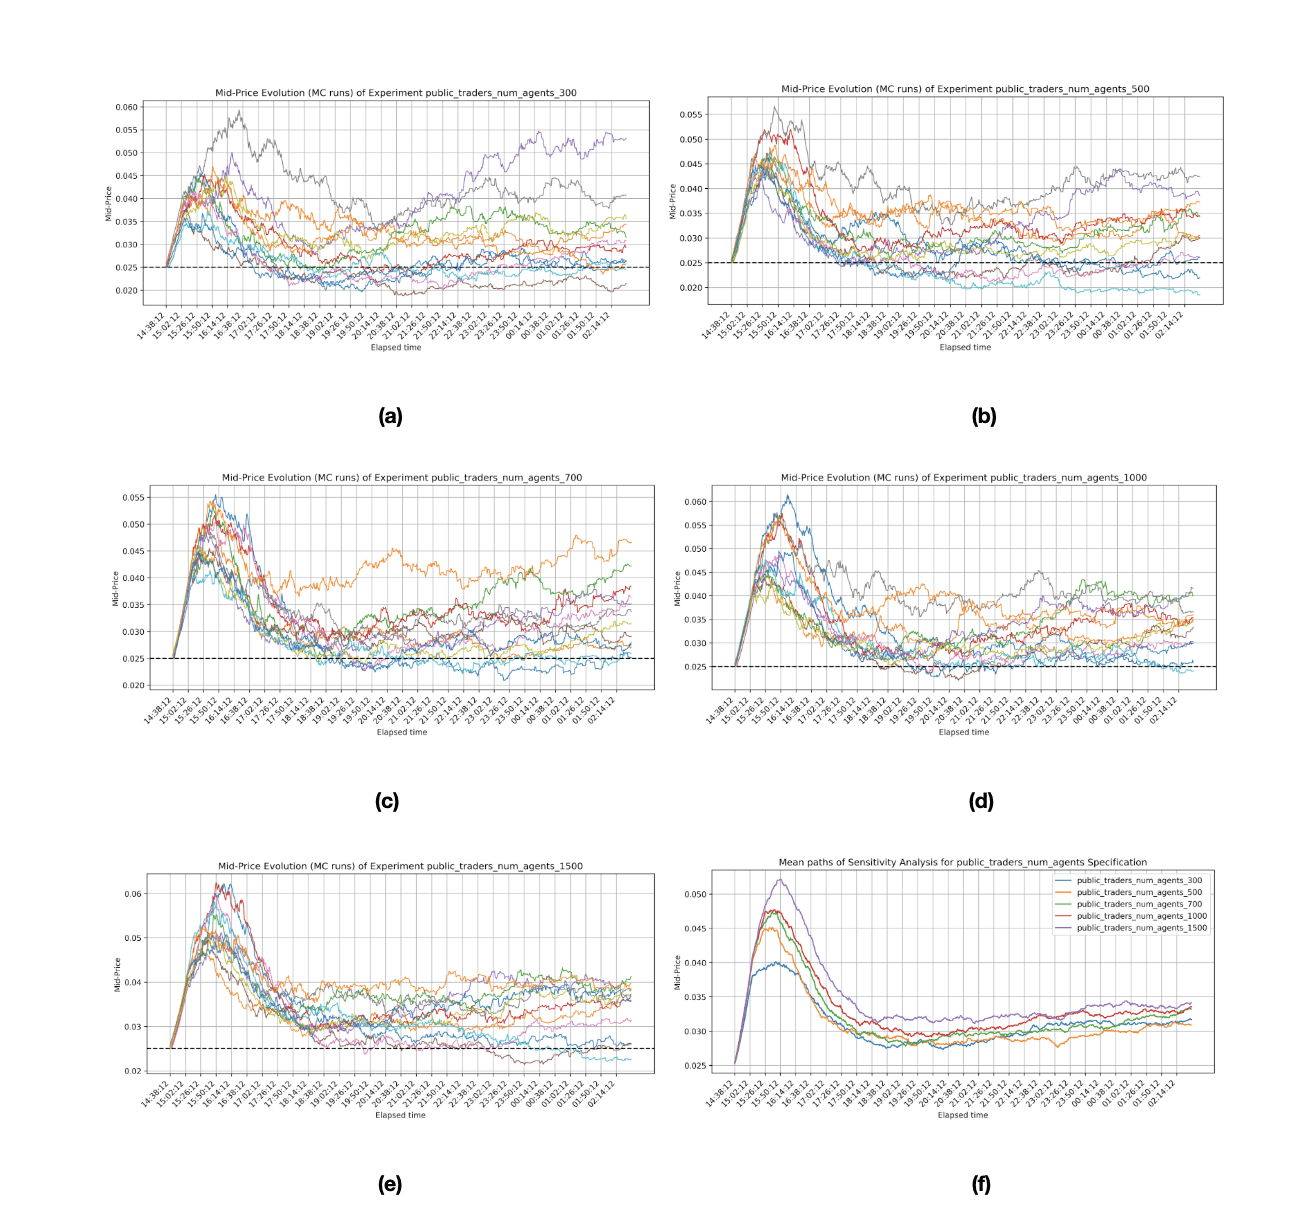
Figure 5. Monte Carlo Simulations for Five Experiments are shown in (a) to (e), and Average Paths for Experiments are shown in (f).
Agents' Risk Levels
We evaluate how risk aversion versus risk-seeking behavior among early investors shapes price discovery and resilience in the listing. Five risk bands—from very conservative (0–1) to highly aggressive (8–10)—reveal stark contrasts across the three investor cohorts:
Private Sale Investors: Both risk-averse (0–1) and high-risk (8–10) cases seem to create a very similar average price behaviour, highlighting no relevant differences. Therefore, we can deduce that the private sale investors' risk level does not significantly affect prices, most likely because of the reduced number of private sale investors in the market and the share they represent in the market.
Strategic Sale Investors: Here, conservative participants drive steeper early corrections with only modest rebounds, whereas risk-tolerant strategic investors exhibit measured, forward-looking sell decisions, resulting in reduced volatility and sustained higher mid-price trajectories throughout the simulated horizon. The differences between the price evolution of each case are easily observable. Hence, for a relatively large number of strategic sale investors with a realistic amount of tokens, risk aversion is a significant factor affecting prices in our framework.
Public Sale Investors: Low-risk public investors often liquidate quickly, mirroring panic selling that suppresses momentum and delays recovery, while high-risk retail holders maintain positions longer, fostering smoother price paths and enhanced early-stage stability. Because the number of public sale investors tends to be greater than that of the previous two groups, they represent a bigger share of the market and their risk level significantly affects price evolution in our simulations.
While higher risk tolerance tends to support smoother price paths and stronger rebounds, this effect only materializes for investor cohorts that represent a meaningful share of market activity. Small cohorts with limited float (such as private sale investors in our baseline) may not move prices significantly even if their behavioral profile is aggressive or conservative.
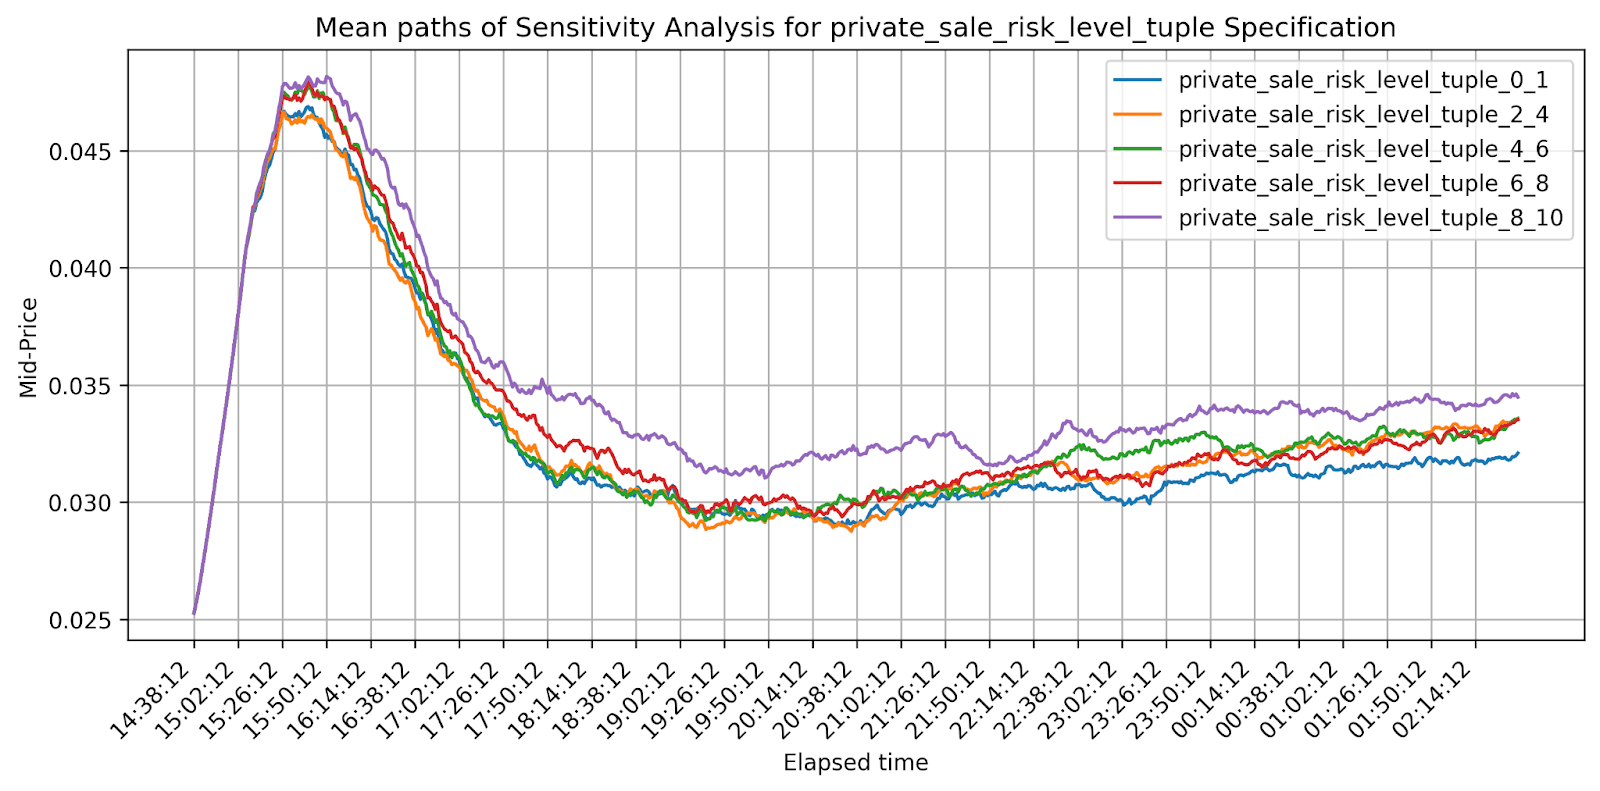
Figure 6. Monte Carlo Experiment Average Results for changing Risk Levels of Private Sale Investors.
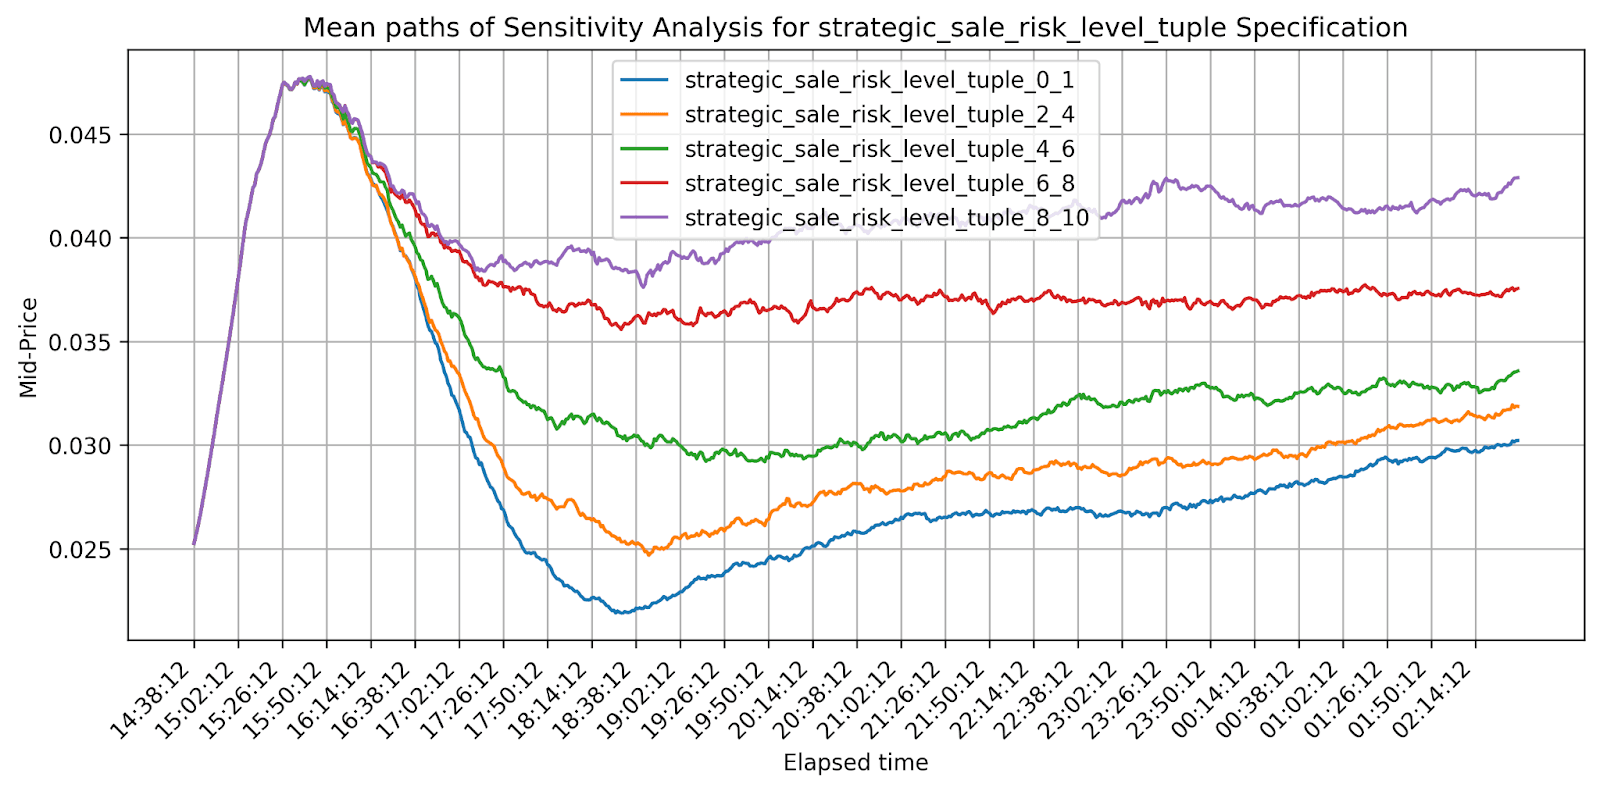
Figure 7. Monte Carlo Experiment Average Results for changing Risk Levels of Strategic Sale Investors.
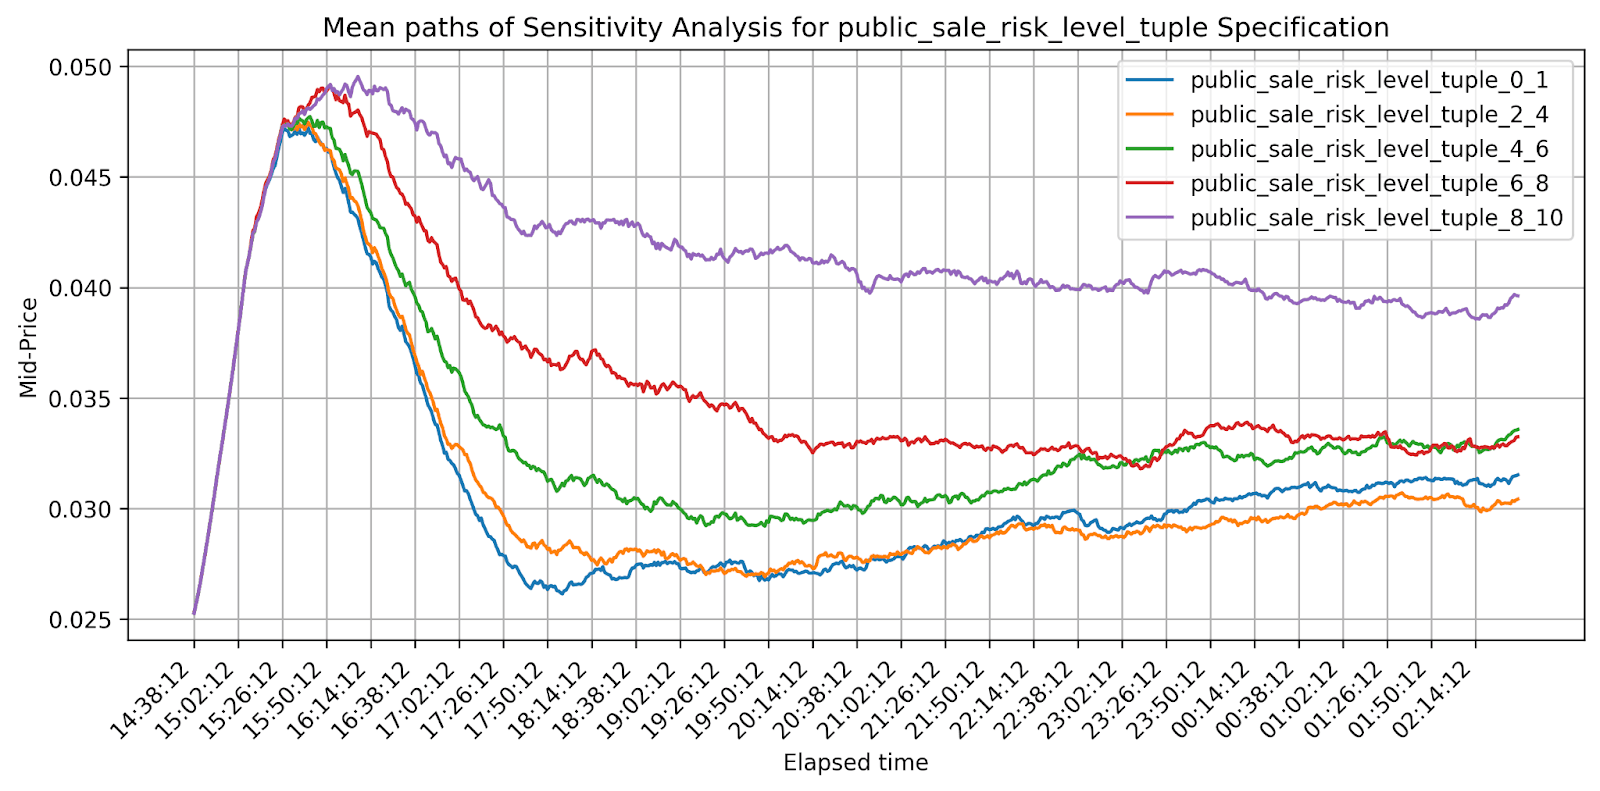
Figure 8. Monte Carlo Experiment Average Results for changing Risk Levels of Public Sale Investors.
Conclusions
Our study introduces a purpose-built agent-based simulation (ABS) framework specifically tailored to the dynamics of cryptocurrency token listings, combining heterogeneous agent behavior, centralized and decentralized market engines, and Monte Carlo plus sensitivity-analysis tools to explore post-listing market mechanics. Through a series of structured experiments, we demonstrate that initial liquidity acts as a volatility lever—low depths amplify price swings while high depths stabilize at the expense of rapid price discovery; that public trader capital is the main driver of demand—low funding levels leave markets unable to absorb early sell-side pressure, resulting in price collapses and muted recoveries, intermediate funding produces pronounced price surges followed by healthier corrections, and excessive allocations can push prices to inflated peaks and heightened volatility with divergent recovery patterns; that trader population size invokes the law of large numbers, smoothing out idiosyncratic noise; and that agent risk preferences exert the most dramatic and consistent influence, where risk-averse cohorts trigger early dumps and weak recoveries while risk-tolerant groups support more gradual pricing and stronger rebounds. For crypto founders, market makers, and institutional allocators, our ABS framework offers a transparent, replicable stress-testing environment—enabling “what-if” analyses of tokenomics and launch strategies to engineer more resilient markets before real capital is at risk.
Subscribe to our Substack and get our latest updates delivered directly to your inbox—before they’re released anywhere else.